In baseball, “LOB” (Left On Base) is an important indicator that indicates the number of runners left on base during a game.
This metric is widely used to evaluate how well a team or player converts their scoring opportunities.
This article provides a detailed explanation of the basic concept of LOB, its historical background, the latest statistical analysis, strategic usage methods, success stories, and future prospects.
Additionally, we will provide specific examples of how to incorporate LOBs into your team strategy.
This will provide you with specific tips to help your team maximise their scoring potential and improve their chances of winning matches.
So let’s start with the basic concept of what LOBs are.
目次
- 1 What is LOB? Understanding the basic concepts
- 2 History and Evolution: From the Origins of LOB to the Present
- 3 LOB Statistics: What the Data Says
- 4 How to use LOB from a strategic perspective
- 5 Success Story: Introducing Teams and Players Using LOB
- 6 The Future of LOB: Evolving Data Analytics and Strategies
- 7 Hands-on: How to get LOBs into your team
What is LOB? Understanding the basic concepts
In baseball, “LOB” (Left On Base) is an indicator of the number of runners remaining on base at the end of an inning in a game.
This metric plays an important role in assessing the efficiency of a team or player’s scoring opportunities.
LOB reveals the reasons for missed scoring opportunities and can be used to improve team strategies and player performance.
The importance of LOB is how often a player is put out with runners still on base in a situation that could result in a run being scored.
A high LOB represents a team’s lack of scoring opportunities despite many on-base opportunities, reducing their efficiency.
Conversely, a low LOB indicates the ability to convert on-base opportunities into runs.
What is LOB and what is its importance?
LOB is a key in-game statistic that measures the number of runners remaining on base at the end of each inning.
Specifically, if a batter reaches base and the next batter comes to bat but is unable to score, ending the inning, the runner is recorded as “left on base.”
LOB is also measured for individual batters and is used to understand and evaluate each player’s scoring opportunities.
The importance of LOB is evident in match strategy and performance evaluation.
For example, if many runners remain on base during a game, the team misses out on many scoring opportunities.
Therefore, by analyzing the LOB, you can evaluate your team’s offensive power and scoring efficiency and identify areas for improvement.
Additionally, LOB is used as an indicator to measure a player’s clutch hitting ability, i.e., batting performance in key situations.
How LOB% is calculated and what it means
LOB% (Left On Base Percentage) is an indicator that shows the percentage of runners put on base by a pitcher who remain on base without scoring.
It is used to evaluate a pitcher’s tenacity and defensive ability. The specific calculation method is as follows:
This formula is calculated by combining not only the number of runners left on base, which is recorded in the actual score, but also other statistics such as walks and home runs.
This allows for a more comprehensive evaluation of a pitcher’s performance.
LOB% is a very important indicator for evaluating a pitcher’s ability and defensive power.
For example, a pitcher with a high LOB% indicates that he is less likely to allow runs even when he allows runners on base, which means he is particularly strong in tight situations.
On the other hand, a pitcher with a low LOB% indicates that they are more likely to allow runs when they allow runners on base.
LOB% also tends to be higher for teams with strong defense and pitchers with high strikeout rates.
Pitchers with a high number of strikeouts tend to have a high LOB% because they are able to get outs without advancing runners.
Additionally, teams with strong defenses also do not allow runners to return home, which keeps their LOB% high.
As such, LOB and LOB% are important indicators in baseball and are essential elements for comprehensively evaluating the performance of teams and players.
These metrics can help your team improve their strategy and increase their chances of winning matches.

History and Evolution: From the Origins of LOB to the Present
In baseball, “LOB” (Left On Base) is an important indicator that shows the number of runners remaining on base during a game.
This metric is used to evaluate the efficiency of scoring opportunities and provide an overall assessment of a team’s performance.
Here we take a closer look at the historical background of LOBs and their development.
Historical background of LOB
The concept of the LOB dates back to the late 19th century, when baseball first had official rules.
At that time in baseball, only the number of runs scored was important, and the number of runners left on base was not given much attention as a game record.
However, as the need for detailed analysis of game data increased, the number of runners left on base came to be recognized as an important statistical data item.
In the late 19th and early 20th centuries, baseball statistical analysis evolved, with basic statistics such as batting average and earned run average being recorded.
In this context, attention has begun to be paid to the number of runners left on base as a factor in missing scoring opportunities.
In particular, when evaluating a team’s offensive power, the number of runners left on base has come to be seen as an important indicator of low scoring efficiency.
Official recording of LOBs was established in the mid-20th century when Major League Baseball (MLB) officially adopted it as a statistical statistic.
This has allowed for the accumulation of detailed data on each match, laying the foundation for more accurate evaluation of team and player performance.
The Development of LOBs in Major League Baseball
The concept of LOB has become increasingly important in Major League Baseball.
As sabermetrics (a statistical analysis technique in baseball) began to become popular in the 1970s and 1980s, the LOB came to be positioned as an important element of team strategy.
Sabermetrics pioneer Bill James used a variety of statistics, including LOB, to bring a new perspective to the traditional winning formula.
With the spread of sabermetrics, a new indicator called LOB% (Left On Base Percentage) has emerged.
LOB% is an indicator that shows the percentage of runners that a pitcher puts on base that remain without scoring, and is important for evaluating a pitcher’s performance.
This makes it possible to evaluate games based not only on the simple number of runners left on base, but also on the pitcher’s tenacity and the impact of his defense.
As we enter the 21st century, data analysis technology has evolved dramatically, making it possible to analyze more detailed and complex statistical data.
Now, each team has access to advanced analytical tools to analyze a variety of data in real time, including LOB and LOB%.
This allows for a more scientific approach to in-game strategic decisions and improving player performance.
The evolution of the LOB has seen it progress from simply recording statistical data to modern-day advanced data analysis as an integral part of baseball strategy and performance evaluation.
The role of LOBs will continue to evolve in the future as data analysis technology advances.
In this way, the LOB has evolved throughout baseball’s history and is an important part of modern data analysis.
An understanding of the LOB and its development is essential to comprehensively evaluate team and player performance.
Going forward, it will be necessary to continue to pursue more effective strategies and higher performance through LOB analysis.

LOB Statistics: What the Data Says
In baseball, “LOB” (Left On Base) is an important indicator that shows the number of runners remaining on base during a game.
In particular, LOB% (Left On Base Percentage) plays an important role in a pitcher’s performance and team strategy.
Here we’ll take a closer look at how LOB% is analyzed, what its impact is, and the difference between LOB% for pitchers and hitters.
How LOB% is interpreted and what are its effects?
LOB% is an indicator of the percentage of runners that a pitcher puts on base but do not score.
By analyzing this, we can evaluate the pitcher’s tenacity and the impact of his defense.
The specific calculation method is as follows:
This formula takes into account not only the number of runners left on base, which is recorded in the actual score, but also other statistics such as walks and home runs.
This allows for a more comprehensive evaluation of a pitcher’s performance that cannot be seen simply by the number of runners left on base.
A pitcher with a high LOB% is less likely to allow runs even when they allow runners on base, and shows that they have the ability to pitch tenaciously, especially in pressure situations.
In contrast, pitchers with a low LOB% are more likely to allow runs when they allow runners on base.
Analyzing LOB% is also important for evaluating a team’s defensive strength.
For example, a team with a high LOB% can be judged to have good defense that prevents runners from scoring.
LOB% is also used as an indicator to predict team performance and player performance during the season.
In particular, pitchers with extremely high or low LOB% tend to perform closer to average the following year, which can be useful in predicting a player’s performance.
Differences between pitcher and batter LOB%
Although LOB% is primarily used to evaluate pitcher performance, it also plays an important role in evaluating hitter performance.
Understanding the difference between pitcher and batter LOB% can help you plan your game strategy more effectively.
A pitcher’s LOB% indicates the percentage of runners that he puts on base but doesn’t score.
A pitcher with a high LOB% demonstrates his ability to pitch tenaciously under pressure and remain composed to get the out, especially with runners in scoring position.
A batter’s LOB% on the other hand, indicates the percentage of runners that the batter left on base.
This is an indicator that evaluates how well a batter is capitalizing on scoring opportunities.
Batters with a high LOB% tend to leave more runners on base, indicating they are more likely to miss scoring opportunities.
Conversely, a hitter with a low LOB% is indicative of a greater ability to capitalize on scoring opportunities and bring runners home.
In this way, understanding the difference between pitchers’ and batters’ LOB% can help you plan your team’s strategies more effectively.
For example, using a pitcher with a high LOB% can increase the chances of preventing a run.
On the other hand, placing hitters with low LOB% in key parts of the batting order can help maximize scoring opportunities.
LOB% analysis plays a very important role in baseball strategy and performance evaluation.
By understanding this metric and using it properly, you can develop specific strategies to improve your team’s chances of winning.
As data analysis technology continues to evolve, the role of LOB% will become even more important.

How to use LOB from a strategic perspective
In baseball, “LOB” (Left On Base) is an important indicator that indicates the number of times runners remain on base during a game and is used to evaluate the efficiency of a team’s scoring opportunities.
This metric is also extremely valuable from a strategic perspective.
In particular, by understanding the characteristics of pitchers with a high LOB% and the role of LOB in team strategy, you can find specific ways to improve your chances of winning a game.
Characteristics of pitchers with high LOB%
A pitcher with a high LOB% is excellent at preventing runs even when he allows runners to get on base.
This reflects the pitcher’s technique and mental strength. Below are the characteristics of pitchers with a high LOB%.
1. High strikeout rate
Pitchers with a high LOB% often have a high strikeout rate. A strikeout is the surest way to cut off a scoring opportunity with runners on base. Pitchers with a high number of strikeouts can put pressure on opposing batters, making them more likely to make batting errors.
2. Effective pitching rhythm
A pitcher with a high LOB% has a stable pitching rhythm and can pitch with confidence even in important situations during the game. This shows that the pitcher can pitch without losing his rhythm, and can maintain constant pressure on the opposing batter.
3. Mental strength
Pitchers with a high LOB% have the mental strength to remain calm even under pressure. In particular, pitching with runners in scoring position creates a lot of mental pressure, so a strong mentality is important.
4. Excellent ball control
A pitcher with good ball control can reduce the number of walks and keep runners off base. Pitchers with good ball control can easily get a favorable count against batters and pitch in a way that makes them hit the ball.
The role of LOB in team strategy
LOBs also play a key role in team strategy.
In order to maximize scoring opportunities and minimize conceded runs, it is necessary to properly utilize LOB data.
1. Pitcher usage
By using a pitcher with a high LOB% appropriately, you can prevent runs from being scored at important times in the game. In particular, by using a pitcher with a high LOB% in a pinch situation, you can increase the chances of not allowing runners to score.
2. Defensive Positioning
Based on LOB data, you can also optimize your defensive positioning. For example, you can set up defensive shifts against specific batters to prevent hits and keep runners from advancing. This reduces the chances of runners being in scoring position.
3. Batting Strategy
It is also effective to consider the batter’s LOB% when arranging the batting order. By placing a batter who is good at scoring in the cleanup position, you can increase the chances of bringing runners home. Conversely, it is preferable to use batters with a high LOB% when there are few runners on base.
4. Practice and training
By analyzing LOB data, players’ weaknesses can be identified and reflected in training, for example by strengthening hitting or pitching practice under pressure to improve performance in games.
In this way, LOB data is an essential element in optimizing team strategies and improving match win rates.
By understanding the characteristics of pitchers with a high LOB% and developing a strategy based on that, you can improve the performance of your entire team.
As data analysis evolves, the role of LOB will become increasingly important in the future.

Success Story: Introducing Teams and Players Using LOB
In baseball, “LOB” (Left On Base) is an important indicator that shows the number of runners remaining on base during a game.
By making good use of this metric, you can improve the performance of your team and players.
Here we will introduce some success stories of utilizing LOBs in Major League Baseball and Japanese professional baseball.
Major League Success Stories
In Major League Baseball (MLB), many teams are strategically using LOB data and achieving great results.
Here are some particularly successful examples:
1. Boston Red Sox
The Boston Red Sox welcomed Bill James, a pioneer of sabermetrics, as an advisor and conducted thorough data analysis to develop a strategy that utilizes LOB%. In particular, in the 2018 season, the pitchers maintained a high LOB% and demonstrated tenacity in preventing runs even when they allowed runners to get on base. As a result, the Red Sox recorded the best winning percentage in the league and won the World Series.
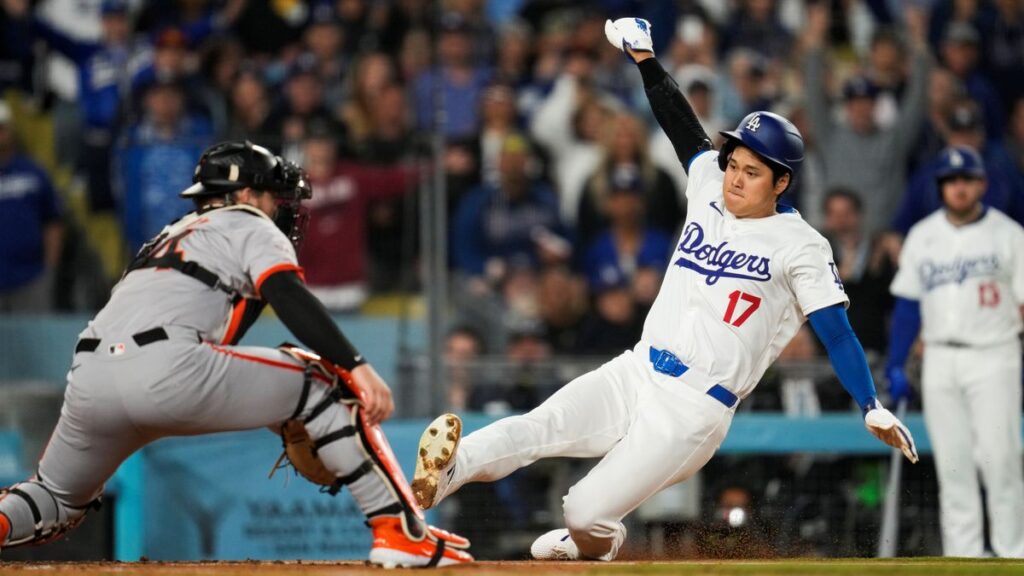
2. Los Angeles Dodgers
The Los Angeles Dodgers are one team that placed importance on LOB%. The Dodgers analyzed the performance of their pitchers in detail and used pitchers with high LOB% as closers or setup men. In the 2017 and 2018 seasons, the entire pitching staff maintained a high LOB%, and the Dodgers advanced to the World Series in both seasons.
3. Tampa Bay Rays
The Tampa Bay Rays are a successful team that utilizes data analysis despite their low budget. The Rays use various data, including LOB%, to optimize pitching and defensive positioning during games. In particular, they introduced an opener strategy, bringing in relief pitchers with high LOB% early in the game, which was a new approach to preventing runs.
Examples of use in Japanese professional baseball
There are also many success stories in the Nippon Professional Baseball (NPB) sector that utilize LOB data.
Below are some examples:
1. Fukuoka SoftBank Hawks
The Fukuoka SoftBank Hawks are a team that actively incorporates data analysis. In particular, they place importance on the LOB% of their pitchers, and employ pitchers with high tenacity as closers and relievers to prevent runs at key moments in the game. As a result, the Hawks have won many Japan Series titles in the 2010s.
2. Yomiuri Giants
The Yomiuri Giants are known as a traditionally strong team, but in recent years they have adopted data analysis and are developing strategies that utilize LOB data. The Giants organize their relief corps around pitchers with high LOB% and show tenacity in the final stages of games, winning many close games.
3. Hiroshima Toyo Carp
The Hiroshima Toyo Carp is one team that has been successful using LOB data. In particular, when developing young pitchers, they were trained to aim for a high LOB% and develop tenacious pitching. This led the Carp to win the Central League three times in a row from 2016 to 2018.
In this way, many teams in both Major League Baseball and Nippon Professional Baseball have achieved success by strategically utilizing LOB data.
These success stories demonstrate the importance of data analytics and the power of leveraging the right metrics.
It is expected that the team will continue to improve its strategy and performance by making full use of a variety of data, including LOB data.

The Future of LOB: Evolving Data Analytics and Strategies
In baseball, “LOB” (Left On Base) is an important indicator that indicates the number of times runners remain on base during a game and is used to evaluate the efficiency of a team’s scoring opportunities.
As data analysis technology evolves, LOB analysis is also becoming increasingly sophisticated.
Here we take a closer look at new analytical tools and their implementation, as well as next-generation strategies and predictions.
New analysis tools and their implementation
In recent years, data analysis in baseball has evolved dramatically.
With the introduction of new analysis tools, LOB data is now analyzed in greater detail and with greater accuracy.
1. The evolution of sports analytics software
Sports analytics software can collect and analyze a huge amount of data during a game in real time. This allows you to quickly understand each pitcher’s LOB% and its fluctuations. For example, systems such as Statcast and TrackMan provide detailed analysis of pitch speed, rotation rate, trajectory of the batted ball, etc., and provide data to evaluate the performance of pitchers and batters.
2. Introducing machine learning and artificial intelligence
The introduction of machine learning and artificial intelligence (AI) has dramatically improved the accuracy and speed of data analysis. AI learns from past game data and builds models to predict future performance. This makes it possible to predict a pitcher’s LOB% and suggest optimal strategies for specific situations. For example, an AI-based predictive model can pre-evaluate a pitcher’s performance when there are runners on base, helping with strategy decisions during a game.
3. Utilizing Big Data
Advances in big data technology have made it possible to analyze more data quickly and efficiently. This makes it possible to comprehensively evaluate all aspects of a game, not just LOB%, and big data analysis is also being used to optimize players’ physical condition and training.
Next Generation Strategies and Predictions
With the introduction of new analytical tools, next-generation strategies and predictions are increasingly taking shape.
Below we introduce next-generation strategies and predictions for future LOB utilization.
1. Advanced defensive positioning optimization
In next-generation strategies, advanced defensive arrangements based on data analysis play an important role. For example, by setting defensive shifts for specific batters more precisely, strategies are being adopted to prevent hits and keep runners off base. This is expected to improve the defensive ability of the entire team and improve LOB%.
2. Changing strategies based on real-time data
Real-time data analysis allows for swift and accurate strategy changes during a game. For example, you can instantly analyze the pitcher’s condition and the tendencies of the opposing batters, and make pitcher changes or defensive shift changes at the right time. This allows you to take advantage of the flow of the game.
3. Individualized tutoring and training
The spread of individual instruction and personalized training based on data analysis is expected to improve player performance. For example, pitchers will receive mental training and technical guidance to maintain a high LOB%, and batters will be provided with special training to improve their batting skills when in scoring position.
4. Continuous data feedback
By providing players and coaches with continuous data feedback, performance improvements can be promoted. For example, specific improvements for the next game can be suggested based on the results of post-game data analysis, accelerating player development.
As such, the future of LOB is looking brighter with evolving data analytics technologies.
The introduction of new analytical tools has enabled teams to develop more sophisticated strategies and improve player performance.
As data analysis continues to evolve, the role of LOBs will become even more important and will be positioned as an essential element in baseball strategy and performance evaluation.

Hands-on: How to get LOBs into your team
In baseball, “LOB” (Left On Base) is an important indicator for increasing a team’s scoring efficiency.
By making good use of LOB data, you can improve your performance in matches.
Here we will go into detail about the basic steps and points to note for incorporating LOB into your team, as well as how to apply it in training and practice.
Basic steps and points to note
To incorporate LOBs into your team, it’s important to take these basic steps:
1. Data Collection
First, we collect all data on runners left on base during a game accurately. This means recording the detailed situations of each batter and runners put on base by the pitcher. This provides the basic data for calculating and evaluating each player’s LOB%.
2. Data Analysis
The collected data is analyzed to evaluate the performance of each player. In particular, LOB% (Left On Base Percentage) is calculated to check how well a player is able to utilize scoring opportunities after reaching base. This allows the team’s overall scoring efficiency and the performance of each individual player to be evaluated.
3. Strategy planning
Based on the analysis results, we plan game strategies. By using pitchers with high LOB% in important situations and appropriately positioning batters with low LOB%, we maximize scoring opportunities. In addition, we optimize defensive shifts and determine tactics for bunting and stealing bases based on data.
4. Continuous feedback
After the game, we review the data and provide feedback to the players and coaches. This allows us to clarify areas for improvement for each player and take specific measures for the next game. When providing feedback, we make the data visually so that the players can understand it more easily.
Training and practical application
To effectively utilize LOB, training and practical application are essential. Below are some specific methods.
1. Simulation exercises
We conduct simulation practice sessions that simulate a game, practicing pitching and batting with runners on base. This allows players to get used to the pressure of a real game and make the right decisions. It is especially important for closers and relief pitchers to practice situations with the ball in scoring position.
2. Mental training
Maintaining a high LOB% also requires mental toughness, so incorporate mental training to stay calm under pressure, including concentration exercises and stress management techniques.
3. Technical training
Pitchers train to improve their control, especially when there are runners on base, while batters practice to improve their ability to respond to specific pitch types in order to hone their hitting skills when in scoring position.
4. Practical training using data
During the game, the collected data is used to provide real-time guidance. For example, by understanding the batter’s tendencies and adjusting defensive shifts appropriately, hits can be prevented. In addition, the condition of the pitcher is monitored to determine when a substitution should be made at an appropriate time.
In this way, by collecting LOB data, analyzing it, and incorporating it into your strategy, you can significantly improve your team’s performance.
By combining training with practical application, we can maximize the abilities of our players and lead them to victory in matches.
As data analysis evolves, the way LOBs are utilized will continue to evolve.